Quote (saber_x3 @ Jun 3 2014 02:56pm)
there is more information?
http://practicalmaintenance.net/wp-content/uploads/TTT-curve-for-carbon-steel-AISI-1050.jpg
He has enough information, that is the wrong graph.
You need to use lever rule for an image such as the following:
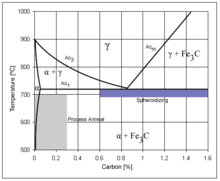
1050 steel's carbon content is 0.5%.
Couldn't find a bigger pic, and don't remember the name of the chart. :x
This post was edited by Dontrunaway on Jun 3 2014 09:32pm